Graphics and visualisation
We apply computer graphics and visualisation in new application contexts to solve challenges for sense making, capturing accurate 3D information, representing real people and places, and new and creative ways to make data visible.
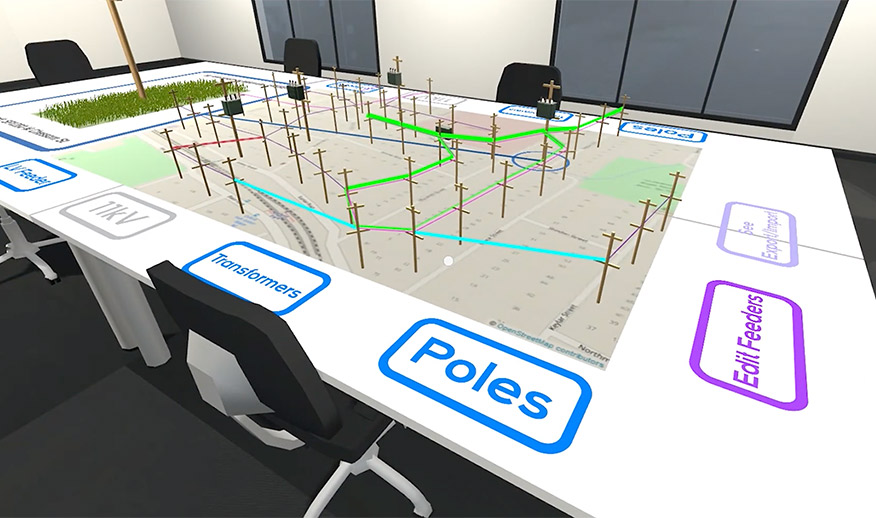 In collaboration with the UQ Centre for Energy Data Innovation, we are applying these methods to sensemaking of data from the digital transformation of the Energy Grid.
Our research is making impacts in the understanding of energy usage, natural disaster grid response, experiences of people impacted by outages, data security and privacy and effective support for decision making through visual analysis.
Get in touch
For more information about current graphics and visualisation projects and opportunities to collaborate, please get in touch.